How to choose the right elasticity for cell culture

If you consider which stiffness to use for a given cell type, the answer usually arrives as a single number: 1 kPa for neural, 10 kPa for muscle, 30 kPa for bone. Those numbers are useful shorthand, but they are also the source of a great deal of irreproducibility, because the same tissue can be reported at values an order of magnitude apart depending on how it was measured.
This article gives a working reference of tissue stiffness from brain to bone, then sets out the caveats that determine whether a number from the literature can be transferred to your culture system at all. These caveats are not simply footnotes. They are the reason the field's numbers disagree.
What Is Actually Being Measured
Three quantities get called stiffness and they are not interchangeable.
Young's modulus (E) describes resistance to uniaxial stretch or compression. It is what indentation and tensile testing report, and what almost all 2D substrate products are specified in.
Shear modulus (G, or the storage modulus G') describes resistance to shear. It is what a rheometer reports, and it is the natural measurement for a hydrogel that cannot easily be gripped for tension.
Bulk modulus (K) describes resistance to uniform compression and rarely appears in cell biology.
The conversion between the first two is E = 2G(1 + v), where v is Poisson's ratio. Assuming incompressibility (v = 0.5) gives the familiar E = 3G, and that assumption is applied almost universally to hydrogels and soft tissues. It is a reasonable approximation but not a guaranteed one: work measuring Poisson's ratio directly in polyacrylamide gels and PDMS found that the value can deviate meaningfully from 0.5, and soft hydrogels are often genuinely compressible. A factor of three applied without comment is the single most common silent error when comparing a rheology figure to an indentation figure.
Practical rule: before comparing two stiffness values, establish whether each is E or G. A 1 kPa gel by rheology is roughly a 3 kPa gel by indentation. Many apparent disagreements in the literature dissolve at this step.
Reference Table: Tissue Stiffness from Brain to Bone
The values below are indicative Young's modulus ranges compiled from the mechanobiology literature. They are given as ranges rather than single figures because ranges are what the primary data support.
| Indicative elastic modulus (Young's modulus, E) of mammalian tissues | |||
| Tissue | Typical reported range | Common substrate target | Notes and principal caveat |
| Brain (grey and white matter) | 0.1 to 1 kPa | 0.1 to 1 kPa | Highly method-dependent; elastography at 70 to 120 Hz returns values far above ex vivo indentation for the same tissue |
| Bone marrow | 0.3 to 40 kPa | 0.5 to 25 kPa | Spatially graded, from soft sinusoidal regions to stiff endosteal regions; a single value is not meaningful |
| Lung parenchyma | 0.2 to 2 kPa | 0.5 to 2 kPa | Strongly inflation-state dependent; fibrotic lung is reported around 17 kPa |
| Liver | 0.3 to 6 kPa | 0.5 to 2 kPa | Clinical elastography and ex vivo rheology give systematically different figures; fibrotic and cirrhotic liver reported from 3 to 22 kPa |
| Adipose tissue | 0.5 to 3 kPa | 1 to 2 kPa | Highly nonlinear; stiffens substantially under compression |
| Mammary tissue (normal) | 0.2 to 1.8 kPa | 0.5 to 2 kPa | Tumour tissue reported from around 3 to 10 kPa depending on method and subtype |
| Pancreas (normal) | 1 to 3 kPa | 1 to 4 kPa | Pancreatic carcinoma commonly reported above 4 kPa, with desmoplastic regions considerably stiffer |
| Blood vessel wall | 1 to 10 kPa | 2 to 12 kPa | Layered and anisotropic; unpressurised values differ from physiological loading |
| Striated and skeletal muscle | 8 to 17 kPa | 8 to 12 kPa | Passive values; contractile state and fibre direction both change the measurement |
| Cartilage (pericellular to bulk) | 25 kPa to over 1 MPa | 25 to 100 kPa | The pericellular matrix a chondrocyte experiences is orders of magnitude softer than bulk cartilage; specify which you mean |
| Osteoid and pre-calcified bone | 25 to 40 kPa | 25 to 50 kPa | This, not mineralised bone, is the relevant target for osteogenic differentiation studies |
| Calcified bone | 1 to 20 GPa | Not reproducible in hydrogel | Roughly six orders of magnitude above brain; hydrogel systems cannot reach this range |
| Tissue culture polystyrene | Around 3 GPa | The default control | Stiffer than every soft tissue in the body by a factor of a million or more |
| Glass | Around 70 GPa | Reference only | Included to show the scale of the departure from physiology in conventional culture |
The bottom two rows deserve attention. Conventional culture surfaces are not merely at the stiff end of the physiological range, they are six orders of magnitude outside it. Whatever stiffness you select, plastic is not the neutral baseline it is often treated as.
The Stiffness Landscape
The tool below places the tissues from the table on a logarithmic stiffness axis alongside the standard substrate stiffness values available in pre-fabricated hydrogel plates. Move the slider to a target modulus and the panel reports which tissues fall in that range and the nearest available substrate value.
Figure: Tissue stiffness on a logarithmic scale, with standard hydrogel substrate values marked. Ranges are indicative and method-dependent, and are shown to convey relative position rather than definitive values for any given specimen.
Caveat One: The Method Sets the Number
The largest single source of disagreement between published tissue stiffness values is the measurement technique. Brain is the clearest example. Ex vivo indentation and AFM commonly place brain below 1 kPa, while magnetic resonance elastography, which probes at vibration frequencies of roughly 70 to 120 Hz, returns values that can be an order of magnitude higher for the same tissue. Both are correct measurements. They are measurements of different things.
| Measurement methods and what they report | |||
| Method | Length scale | Reports | Systematic bias to be aware of |
| AFM indentation | Nanometre to micron | Local E from a contact-mechanics fit | Values rise with indentation depth and rate; tip geometry and the assumed model change the result substantially |
| Microindentation and nanoindentation | Micron to millimetre | Local to mesoscale E | Averages across heterogeneous structure; hydration and preconditioning shift values |
| Shear rheology | Bulk | G' and G'' as a function of frequency | Requires conversion to E; slight axial compression on loading alters the measurement |
| Tensile and compression testing | Bulk | E over a defined strain range | Most tissues are nonlinear, so the reported modulus depends entirely on the strain window chosen |
| Magnetic resonance and ultrasound elastography | Millimetre, in vivo | Shear modulus from wave propagation | High-frequency loading gives systematically higher values than quasi-static ex vivo methods |
The rule that follows is simple. A published tissue value is transferable to your experiment only if you know the method, and it is comparable to another published value only if the methods match. When citing a target stiffness in a paper, cite the method alongside the number.
Caveat Two: Tissues Are Not Linearly Elastic
Every value in the reference table treats tissue as though a single modulus describes it. Almost none of them behave that way.
Most soft tissues strain-stiffen, so the modulus measured at 5% strain is not the modulus at 30%. They are viscoelastic, so the modulus depends on how fast the deformation is applied and relaxes over time after it is applied. Hydrated tissues are also poroelastic: fluid moves through the matrix during deformation, adding a time dependence that has nothing to do with the polymer network itself. A tissue can strain-soften in shear while stiffening in compression, as has been reported for liver.
The practical implication is that a single number is a snapshot taken under one loading condition. When a source reports brain at 0.1 kPa and another at 5 kPa, both may be reporting the same tissue under different strain rates and depths.
Caveat Three: Stiffness Is Not the Only Mechanical Cue
The most consequential development in this field over the past decade is the recognition that viscoelasticity matters independently of stiffness. Work using alginate gels with tunable stress relaxation, at fixed initial elastic modulus, found that mesenchymal stem cell spreading, proliferation and osteogenic differentiation were all enhanced in faster-relaxing gels, with cells forming a mineralised collagen-rich matrix in rapidly relaxing hydrogels of 17 kPa initial modulus.
That result cuts across the tidy stiffness-to-lineage mapping. Two gels at the same nominal stiffness can produce different cell fates if their relaxation behaviour differs, and most synthetic hydrogels used in culture are far more elastic than the tissues they are meant to represent. If a stiffness-matched experiment fails to reproduce an expected phenotype, relaxation behaviour is the first thing to check.
What to report alongside stiffness
The measured modulus and whether it is E or G'. The method and the conditions (temperature, hydration, indentation depth or frequency, strain range). Substrate thickness. Ligand type and surface density, since adhesion ligand presentation modulates the stiffness response. Stress relaxation half-time if the material is viscoelastic. Together these turn a number into something another laboratory can reproduce.
Caveat Four: 2D and 3D Are Different Experiments
A cell on a 2D gel senses stiffness by pulling against a surface. A cell encapsulated in a 3D gel is confined by that gel in every direction, and the same modulus produces a very different mechanical experience. Degradability, mesh size, ligand density and the cell's ability to remodel its surroundings all enter in 3D and are largely absent in 2D.
Stiffness values from 2D substrate studies therefore do not transfer directly to 3D encapsulation, and a 3D result that contradicts a 2D result is not necessarily a contradiction. It is often a different question. Be explicit about which geometry a target stiffness was derived from.
Caveat Five: Substrate Thickness and Depth Sensing
Cells on thin soft gels can sense the rigid support underneath. The effect is well documented below roughly 10 microns of gel for single cells, and cohesive colonies exert more force and can sense deeper than individual cells. A 1 kPa gel cast too thin behaves mechanically stiffer than its specification.
Commercial defined-stiffness plates address this by casting to a controlled thickness, typically a few hundred microns of polyacrylamide, which is comfortably beyond the depth-sensing range. Laboratory-cast gels are where the problem usually appears, and it is a common explanation for a soft-substrate experiment behaving as though the substrate were stiff.
Turning a Table into an Experiment
A defensible stiffness choice follows a short sequence.
- Define the tissue and the state. Normal liver and fibrotic liver differ by an order of magnitude, as do healthy lung and fibrotic lung; pick the one your question is about.
- Identify the scale the cell experiences. Chondrocytes sit in a pericellular matrix far softer than bulk cartilage; bone marrow is graded from sinusoidal to endosteal regions. Match the local environment, not the organ average.
- Bracket rather than pin. Run at least three stiffnesses spanning the physiological range and one well outside it, since a stiffness response curve is far more informative than a single point and protects you if the literature value turns out to be method-dependent.
- Include a plastic control and treat it as an extreme condition, not a baseline.
- Keep ligand chemistry and density constant across the stiffness series, or the experiment confounds mechanics with adhesion.
- Verify the substrate. Where feasible, measure the gels you actually used rather than trusting a nominal value, particularly for laboratory-cast gels.
Substrates for Defined-Stiffness Work
Cell Guidance Systems supplies substrates across the physiological range. Matrigen Softwell plates provide polyacrylamide hydrogels at standard Young's modulus values of 0.1, 0.2, 0.5, 1, 2, 4, 8, 12, 25, 50 and 100 kPa, in ready-to-use multiwell formats with collagen-coated, Easy Coat and non-activated surface options, so elasticity becomes a controlled variable rather than a fabrication step. For screening where the appropriate stiffness is not yet known, the 96-well HTS format carries the full stiffness series in a single plate.
For 3D work, PeptiGel self-assembling peptide hydrogels are supplied across a range of stiffnesses and charge classes, with PLUS variants carrying integrated RGD and GFOGER motifs so that adhesion ligand presentation can be held constant while stiffness is varied. Related reading: our guides to choosing a cell culture hydrogel and to composite peptide hydrogel formulations. Where a specific modulus or format is required outside the catalogue, the hydrogel production service can manufacture to specification, and PODS depot growth factors can be incorporated where sustained signalling is needed alongside a defined mechanical environment.
Summary
Tissue stiffness spans roughly six orders of magnitude from brain to mineralised bone, and the soft-tissue portion of that range, from about 0.1 to 100 kPa, is where nearly all cell culture questions sit. A reference table is a useful starting point provided its limits are understood: the number depends on the measurement method, tissues are nonlinear and viscoelastic rather than simply elastic, stress relaxation influences cell fate independently of modulus, 2D and 3D geometries are not interchangeable, and thin gels behave stiffer than they are specified. The most robust approach is not to find the correct number but to run a stiffness series, report the method alongside the value, and keep every other variable fixed.
Further Reading
- Engler AJ, Sen S, Sweeney HL, Discher DE. Matrix elasticity directs stem cell lineage specification. Cell. 2006;126(4):677-689.
- Discher DE, Janmey P, Wang YL. Tissue cells feel and respond to the stiffness of their substrate. Science. 2005;310(5751):1139-1143.
- Buxboim A, Ivanovska IL, Discher DE. Matrix elasticity, cytoskeletal forces and physics of the nucleus: how deeply do cells feel outside and in? J Cell Sci. 2010;123(3):297-308.
- Chaudhuri O, Gu L, Klumpers D, et al. Hydrogels with tunable stress relaxation regulate stem cell fate and activity. Nat Mater. 2016;15(3):326-334.
- Chaudhuri O, Cooper-White J, Janmey PA, Mooney DJ, Shenoy VB. Effects of extracellular matrix viscoelasticity on cellular behaviour. Nature. 2020;584(7822):535-546.
- Wells RG. Tissue mechanics and fibrosis. Biochim Biophys Acta. 2013;1832(7):884-890.
- Canovic EP, Qing B, Mijailovic AS, et al. Characterizing multiscale mechanical properties of brain tissue using atomic force microscopy, impact indentation, and rheometry. J Vis Exp. 2016;(115):54201.
- Budday S, Ovaert TC, Holzapfel GA, Steinmann P, Kuhl E. Fifty shades of brain: a review on the mechanical testing and modeling of brain tissue. Arch Comput Methods Eng. 2020;27:1187-1230.
- Perepelyuk M, Chin L, Cao X, et al. Normal and fibrotic rat livers demonstrate shear strain softening and compression stiffening: a model for soft tissue mechanics. PLoS One. 2016;11(1):e0146588.
- Buxboim A, Rajagopal K, Brown AEX, Discher DE. How deeply cells feel: methods for thin gels. J Phys Condens Matter. 2010;22(19):194116.
- Mullen CA, Vaughan TJ, Billiar KL, McNamara LM. The effect of substrate stiffness, thickness, and cross-linking density on osteogenic cell behavior. Biophys J. 2015;108(7):1604-1612.
- Guilak F, Alexopoulos LG, Upton ML, et al. The pericellular matrix as a transducer of biomechanical and biochemical signals in articular cartilage. Ann N Y Acad Sci. 2006;1068:498-512.
- Boudou T, Ohayon J, Picart C, Tracqui P. An extended relationship for the characterization of Young's modulus and Poisson's ratio of tunable polyacrylamide gels. Biorheology. 2006;43(6):721-728.
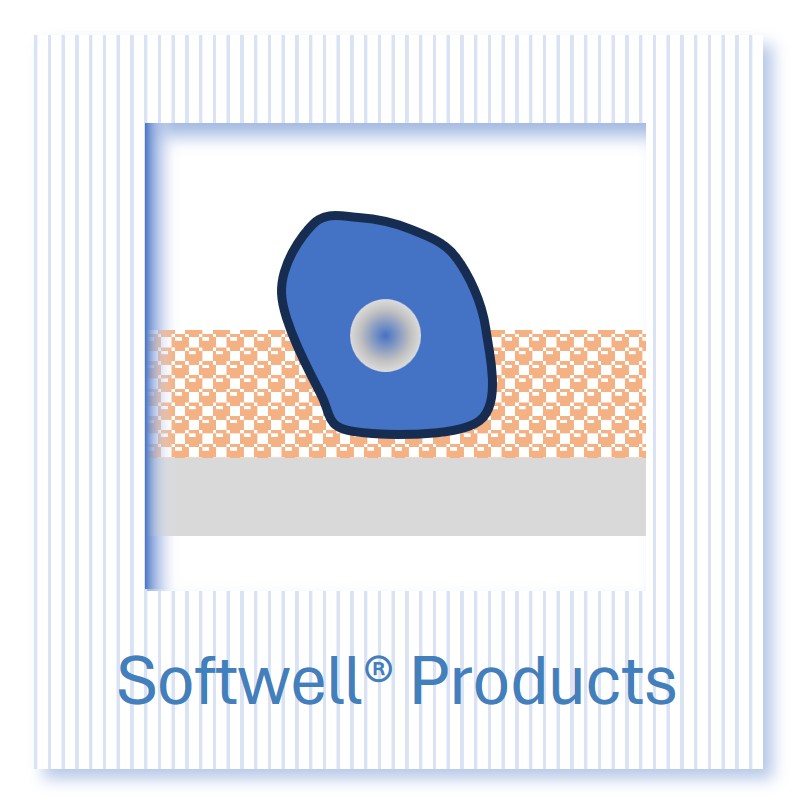
Main Image: Cells on a defined-stiffness hydrogel substrate. Credit: CellGS
Learn more about defined-stiffness substrates and hydrogels from Cell Guidance Systems: