SEC vs ultracentrifugation: What is the difference?

Ultracentrifugation (UC) separates extracellular vesicles (EVs) by how quickly they sediment under high g force. Size exclusion chromatography (SEC) separates them by how large they are in solution, with no force applied at all. That single difference in physical principle accounts for nearly every practical difference between the two methods: the equipment needed, the time taken, the throughput achievable, what contaminants come along, and how much of the vesicle population survives intact.
Both methods are in routine use and both appear throughout the EV literature. Ultracentrifugation has the longer history and remains the most widely cited approach [1]. SEC has grown rapidly since it was first described as a single-step EV isolation method in 2014 [2], and by the time the International Society for Extracellular Vesicles repeated its methods survey, SEC use had risen substantially [3].
This article sets out how each method works, what the head-to-head comparisons found, where each one fails, and how to choose between them for a given sample type and downstream application.
How Each Method Separates EVs
Differential UC applies a sequence of spins of increasing force. Low-speed steps remove cells and debris, an intermediate step at around 10,000 to 20,000 g removes larger vesicles, and a final step at roughly 100,000 to 120,000 g for 70 to 120 minutes pellets the small EV fraction. What ends up in that pellet is determined by sedimentation rate, which depends on particle size, particle density and the viscosity of the surrounding fluid.
SEC passes the sample through a column packed with porous beads. Particles too large to enter the pores travel only through the gaps between beads and elute early in the void volume. Free proteins and other small species enter the pores, take a longer path, and elute later. Nothing is pelleted, nothing is subjected to high force, and separation depends on hydrodynamic size alone. Resin choice sets the working range: the resin in Exo-spin columns is selected to elute particles in the 30 nm to 250 nm range first.
Key point: Ultracentrifugation sorts on sedimentation rate, which folds together size, density and medium viscosity. SEC sorts on size alone. Neither is a purity method in the absolute sense: each one carries a characteristic set of contaminants that follows directly from the property it separates on.
Side by Side
| Ultracentrifugation and size exclusion chromatography compared | ||
| Ultracentrifugation (UC) | Size exclusion chromatography (SEC) | |
| Separates on | Sedimentation rate: size, density and medium viscosity combined | Hydrodynamic size only |
| Equipment | Ultracentrifuge and matched rotor, plus servicing and rotor logs | None beyond a benchtop microfuge for the clarification step |
| Hands-on time | Typically three to five hours for a full differential protocol, longer with a wash step | Under 30 minutes |
| Throughput | Limited by rotor buckets, usually six to eight tubes per run | Limited only by column or plate count, scalable to 96 samples in parallel |
| Sample volume | Tens of millilitres per tube, handles dilute media directly | Set by bed volume: 0.1 ml to 1.0 ml applied directly, larger volumes need concentrating first |
| Effect on the sample | Concentrates into a pellet; pelleting and resuspension can aggregate and damage vesicles | Dilutes across the eluted fractions; vesicles are not compressed or pelleted |
| Characteristic contaminants | Protein aggregates and dense lipoproteins that sediment at similar rates | Lipoproteins that overlap EVs in size, chiefly in plasma and serum |
| Operator dependence | High: rotor type, k factor, g force, run time and resuspension technique all change the result | Low: a fixed bed and a fixed elution volume give a repeatable fractionation profile |
| Cost profile | High capital, low consumable | No capital, modest per-sample consumable cost |
| Subtype separation | Possible when extended with a density gradient | Not on its own; resolves size, not density or surface marker |
Ultracentrifugation Limitations
The difficulties with ultracentrifugation mostly follow from the physics of pelleting nanoscale particles out of a complex fluid.
The result depends on the rotor. Rotor type, g force and spin duration all significantly change the yield and the purity of the vesicles recovered, and commonly recommended protocols are not necessarily optimised for either [4]. Two labs running the same nominal protocol on a swinging bucket and a fixed angle rotor are not running the same protocol, because the sedimentation path length differs. This is why the k factor, not just the g force, belongs in the methods section.
Pelleting causes aggregation. Electron microscopy, gold labelling and flow cytometry of plasma EVs showed that high-speed centrifugation induces aggregates containing vesicles of mixed phenotype and morphology [5]. That matters well beyond appearance. A single-vesicle measurement performed on an aggregated preparation reports the aggregate, and an aggregate assembled from two phenotypes can look like a double-positive vesicle that never existed.
Recovery is incomplete and hard to predict. Theoretical analysis of the standard single 100,000 g step showed that only a fraction of the small vesicle population is actually pelleted under commonly used conditions [6]. Sample viscosity compounds this: plasma and serum are far more viscous than culture medium, so the same spin sediments less.
The choice propagates downstream. Isolation method changes the RNA profile that is subsequently measured, so method choice is not neutral with respect to the biology being reported [7].
None of this makes ultracentrifugation an invalid method. It remains the reference point for a large body of published work, it handles very large volumes of dilute conditioned medium without a concentration step, and when extended with a density gradient it separates on a property SEC cannot access. Where an existing dataset was generated by ultracentrifugation, continuing with it may be the right decision on comparability grounds alone.
SEC Limitations
SEC is a physical process
Lipoproteins co-elute in blood-derived samples. Because SEC resolves size and nothing else, lipoprotein particles that overlap EVs in size travel with them. In a direct comparison of rat plasma, SEC preparations carried greater amounts of APOB positive lipoproteins than the corresponding ultracentrifugation preparations, along with substantial non-vesicular protein in some fractions [8]. Longer column beds improve the separation, and combining SEC with a density-based step removes what size alone cannot, but for plasma and serum work the co-elution should be assumed and controlled for rather than ignored.
Loading volume is capped by the bed. Applying too much sample to a column collapses the resolution. A dilute source such as cell culture medium, urine, saliva or cerebrospinal fluid therefore needs concentrating first, which adds a step that ultracentrifugation does not need.
The eluate can be dilute. Vesicles come off spread across several fractions in buffer. For a downstream assay that needs a concentrated input, a subsequent concentration step may be required.
Key point: Neither method delivers a pure EV preparation from plasma. Ultracentrifugation carries protein aggregates and dense lipoproteins; SEC carries size-matched lipoproteins. The useful question is which contaminant your downstream assay can tolerate, not which method is cleaner in the abstract.
Head-to-Head Studies
| Published direct comparisons of SEC and ultracentrifugation | ||
| Study | Sample | Finding |
| Takov et al. 2019 [8] | Rat plasma | SEC gave higher particle number, higher particle to protein ratio and stronger EV marker signal than UC, but also carried more APOB positive lipoprotein |
| Mol et al. 2017 [9] | Cardiac progenitor and MSC conditioned medium | EVs recovered by SEC showed higher functional activity than those recovered by UC |
| Nordin et al. 2015 [10] | Conditioned medium | Ultrafiltration followed by size exclusion gave high yield while preserving biophysical and functional properties, in contrast to UC |
| Baranyai et al. 2015 [11] | Human blood plasma | Qualitative and quantitative comparison of the two approaches, with protein contamination the principal differentiator |
| Lobb et al. 2015 [12] | Cell culture supernatant and human plasma | An optimised ultrafiltration plus SEC workflow outperformed UC on recovery and purity across both sample types |
| Linares et al. 2015 [5] | Human plasma | High-speed centrifugation induced EV aggregation, a failure mode SEC does not have |
The pattern across these studies is reasonably consistent. SEC recovers more particles, preserves function better and gives a better particle to protein ratio. Ultracentrifugation gives a more concentrated product and, for plasma, a preparation with less lipoprotein carryover. The gain from SEC is largest where vesicle integrity matters, and the gain from ultracentrifugation is largest where lipoprotein interference would otherwise dominate the readout.
Choosing SEC vs UC
| Matching the method to the work | ||
| Situation | Suggested approach | Reason |
| Small volumes of plasma or serum, biomarker discovery | SEC applied directly | Fast, reproducible and no equipment; sample volumes of 0.1 to 1.0 ml load straight onto the column |
| A cohort of tens to hundreds of samples | SEC in a 96-well format | Parallel processing removes the run-to-run drift that batching on a rotor introduces |
| Large volumes of dilute conditioned medium | Concentrate by TFF or ultrafiltration, then SEC | Concentration handles the volume, SEC handles the purification, and neither step pellets the vesicles |
| Functional, uptake or therapeutic studies | SEC | Function is better retained where vesicles are not pelleted and resuspended [9,10] |
| Lipoprotein interference is the dominant concern | A longer SEC bed, or SEC combined with a density step | Size alone cannot resolve size-matched lipoproteins; added bed length improves it and density separation removes it |
| Separating EV subpopulations by density | Density gradient ultracentrifugation | This is the property SEC does not measure |
| Extending an existing UC-based dataset | Continue with UC, or run both in parallel on a subset | Isolation method changes the measured profile, so switching mid-study introduces a confounder [7] |
Combining the Two
The most productive framing is often not SEC against ultracentrifugation but concentration followed by purification. Several of the studies above reached their best results with exactly that structure: reduce the volume first, then resolve the vesicles from the free protein [10,12]. EVlution TFF fills the concentration role for large volumes without a pelleting step, and SEC then performs the separation. Ultracentrifugation can serve the same concentrating role ahead of a column, which is a reasonable use of an instrument a lab already owns.
Whichever route is taken, MISEV2023 is clear that the separation method has to be reported in enough detail for another lab to reproduce it, and that the preparation has to be characterised rather than assumed [13]. For ultracentrifugation that means the rotor, k factor, g force, temperature, duration and whether a wash step was used. For SEC it means the resin, bed dimensions, loading volume and which fractions were pooled. In both cases a particle to protein ratio is worth reporting, since it is the single number that most directly reflects how much of what you have is actually vesicle.
Where Exo-spinTM SEC wins
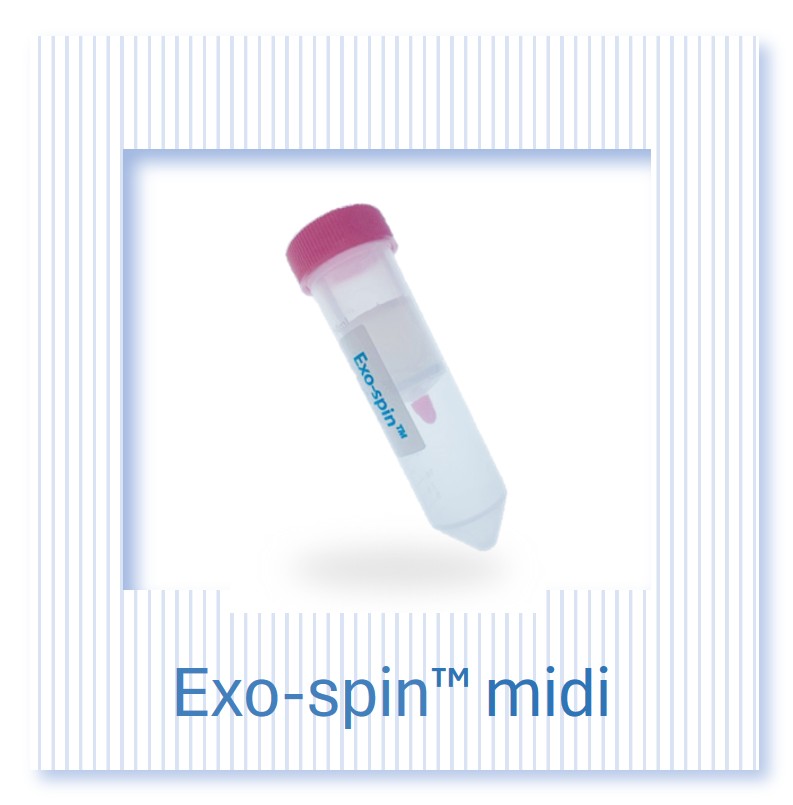
Exo-spin columns remove around 99% of free protein at the shortest bed length, rising to 99.5% and 99.8% with the longer midi and mini-HD beds, and they need no ultracentrifuge. Sample volumes of 0.1 ml to 1.0 ml load directly, larger volumes can be loaded iteratively, and each column can be used up to five times.
The format follows the work. Exo-spin mini-HD has the longest bed and the highest purity, which is where to start if lipoprotein carryover is the limiting problem. Exo-spin 96 uses the same resin and bed geometry as the mini in a 96-well plate, processing a full plate in under 30 minutes, which is the case where the throughput gap against ultracentrifugation is widest. For low-density sources such as culture medium, urine or saliva, the kits supplied with precipitant buffer handle the concentration step.
SEC will suit most EV workflows better than ultracentrifugation on time, reproducibility, throughput and vesicle integrity, and that it will not by itself solve lipoprotein co-isolation from plasma. If that is the specific problem in front of you, a longer bed length or an added density step is the answer.
Summary
UC separates on sedimentation rate and SEC separates on size, and everything else follows from that. UC requires an expensive instrument, takes most of a day, varies with rotor and operator, and aggregates a proportion of the vesicles it recovers. SEC requires no instrument, takes under two hours, gives a repeatable fractionation profile and leaves vesicles intact, but caps the volume that can be loaded and carries size-matched lipoproteins from blood samples.
For most laboratories starting new EV work, SEC is the more practical default, with a concentration step in front of it when the source is dilute. For density-based subtype separation, or for continuity with an established ultracentrifugation dataset, the centrifuge still has a role. What matters most is that the method is chosen deliberately, reported fully and kept constant across the arms of a comparison.
Cell Guidance Systems supplies Exo-spin SEC columns in mini, mini-HD, midi and 96-well formats, EVlution TFF for concentrating large volumes, and ExoLISA assays and an NTA size profiling service for characterising what you isolate. Full EV purification and analysis can also be outsourced through our EV and exosome services.
References
- [1] Gardiner C, Di Vizio D, Sahoo S, Thery C, Witwer KW, Wauben M, Hill AF. Techniques used for the isolation and characterization of extracellular vesicles: results of a worldwide survey. J Extracell Vesicles. 2016;5:32945.
- [2] Boing AN, van der Pol E, Grootemaat AE, Coumans FAW, Sturk A, Nieuwland R. Single-step isolation of extracellular vesicles by size-exclusion chromatography. J Extracell Vesicles. 2014;3:23430.
- [3] Royo F, Thery C, Falcon-Perez JM, Nieuwland R, Witwer KW. Methods for separation and characterization of extracellular vesicles: results of a worldwide survey performed by the ISEV Rigor and Standardization Subcommittee. Cells. 2020;9(9):1955.
- [4] Cvjetkovic A, Lotvall J, Lasser C. The influence of rotor type and centrifugation time on the yield and purity of extracellular vesicles. J Extracell Vesicles. 2014;3:23111.
- [5] Linares R, Tan S, Gounou C, Arraud N, Brisson AR. High-speed centrifugation induces aggregation of extracellular vesicles. J Extracell Vesicles. 2015;4:29509.
- [6] Livshits MA, Khomyakova E, Evtushenko EG, Lazarev VN, Kulemin NA, Semina SE, Generozov EV, Govorun VM. Isolation of exosomes by differential centrifugation: theoretical analysis of a commonly used protocol. Sci Rep. 2015;5:17319.
- [7] Van Deun J, Mestdagh P, Sormunen R, Cocquyt V, Vermaelen K, Vandesompele J, Bracke M, De Wever O, Hendrix A. The impact of disparate isolation methods for extracellular vesicles on downstream RNA profiling. J Extracell Vesicles. 2014;3:24858.
- [8] Takov K, Yellon DM, Davidson SM. Comparison of small extracellular vesicles isolated from plasma by ultracentrifugation or size-exclusion chromatography: yield, purity and functional potential. J Extracell Vesicles. 2019;8(1):1560809.
- [9] Mol EA, Goumans MJ, Doevendans PA, Sluijter JPG, Vader P. Higher functionality of extracellular vesicles isolated using size-exclusion chromatography compared to ultracentrifugation. Nanomedicine. 2017;13(6):2061-2065.
- [10] Nordin JZ, Lee Y, Vader P, Mager I, Johansson HJ, Heusermann W, Wiklander OPB, Hallbrink M, Seow Y, Bultema JJ, Gilthorpe J, Davies T, Fairchild PJ, Gabrielsson S, Meisner-Kober NC, Lehtio J, Smith CIE, Wood MJA, El Andaloussi S. Ultrafiltration with size-exclusion liquid chromatography for high yield isolation of extracellular vesicles preserving intact biophysical and functional properties. Nanomedicine. 2015;11(4):879-883.
- [11] Baranyai T, Herczeg K, Onodi Z, Voszka I, Modos K, Marton N, Nagy G, Mager I, Wood MJ, El Andaloussi S, Palinkas Z, Kumar V, Nagy P, Kittel A, Buzas EI, Ferdinandy P, Giricz Z. Isolation of exosomes from blood plasma: qualitative and quantitative comparison of ultracentrifugation and size exclusion chromatography methods. PLoS One. 2015;10(12):e0145686.
- [12] Lobb RJ, Becker M, Wen SW, Wong CSF, Wiegmans AP, Leimgruber A, Moller A. Optimized exosome isolation protocol for cell culture supernatant and human plasma. J Extracell Vesicles. 2015;4:27031.
- [13] Welsh JA, Goberdhan DCI, O'Driscoll L, et al. Minimal information for studies of extracellular vesicles (MISEV2023): from basic to advanced approaches. J Extracell Vesicles. 2024;13(2):e12404.
Main Image: Size exclusion chromatography separation of exosomes from free protein with Exo-spin. Credit: CellGS
Learn more about EVlution TFF and EV purification tools and protein delivery reagents from Cell Guidance Systems: